Multiple Choice
Figure 16-2 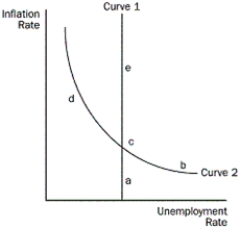
-Refer to the Figure 16-2.If the economy starts at c and the money supply growth rate increases,where does the economy move to in the long run?
A) b
B) d
C) e
D) a
Correct Answer:

Verified
Correct Answer:
Verified
Q4: In the late 1960s, which of the
Q7: Suppose the natural rate of unemployment is
Q15: Figure 16-1 <img src="https://d2lvgg3v3hfg70.cloudfront.net/TB4801/.jpg" alt="Figure 16-1
Q22: Figure 16-4 <img src="https://d2lvgg3v3hfg70.cloudfront.net/TB4801/.jpg" alt="Figure 16-4
Q24: Figure 16-2 <img src="https://d2lvgg3v3hfg70.cloudfront.net/TB4801/.jpg" alt="Figure 16-2
Q70: In 1980, how did the Canadian misery
Q87: Suppose that a central bank increases the
Q98: How will a favourable supply shock shift
Q134: According to the Friedman-Phelps analysis, in the
Q169: What did Friedman and Phelps argue about