Multiple Choice
The following graph represents the total production of a firm on the y-axis, and the number of employees on the x-axis.
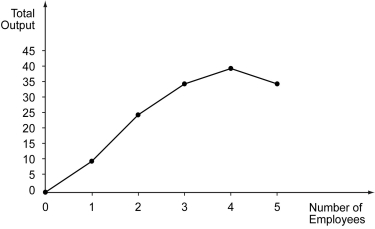
-Refer to the figure above.Specialization begins to occur when the ________.
A) the second worker is hired
B) the third worker is hired
C) the fourth worker is hired
D) the fifth worker is hired
Correct Answer:

Verified
Correct Answer:
Verified
Q17: The following figure depicts a firm's long-run
Q18: If a firm's supply curve is linear
Q19: The following table shows the total output,
Q20: Scenario: A car repair shop hires workers
Q21: Scenario: Selma runs a pastry shop. The
Q23: Is it true that in the long
Q24: Define the terms "economies of scale," "constant
Q25: If the percentage change in the quantity
Q26: As the amount of inventory maintained by
Q27: Marginal cost is the _.<br>A) cost(s) a