Multiple Choice
The following figure depicts a firm's long-run average total cost and selected short-run average total cost curves.
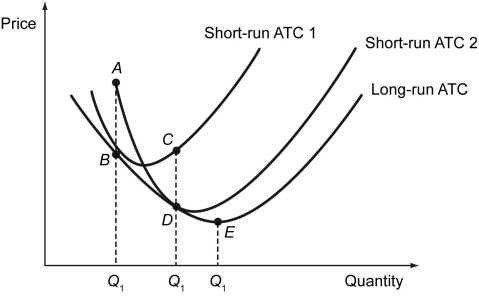
-Refer to the figure above.The firm is currently producing at point D.What prevents the firm from producing at E?
A) Beyond D, the cost of labor becomes too expensive.
B) The firm can produce at E in the short run but decides not to do so, because at D the firm maximizes profits.
C) Producing at E is currently impossible, because too much time is needed to gather the level of capital to produce at E.
D) It is uncertain if producing at E is better than producing at D, because prices are likely to rise in the future.
Correct Answer:

Verified
Correct Answer:
Verified
Q12: Which of the following statements is true
Q13: The long-run average total cost (LRATC)shown below
Q14: Given the following price,quantity,and cost numbers,estimate the
Q15: In a perfectly competitive market,a marginal entrant
Q16: Is the producer surplus same as the
Q18: If a firm's supply curve is linear
Q19: The following table shows the total output,
Q20: Scenario: A car repair shop hires workers
Q21: Scenario: Selma runs a pastry shop. The
Q22: The following graph represents the total production