Multiple Choice
The following graph shows the supply curve of a product.What is the arc price elasticity of supply of this product when its price changes from $12 to $8?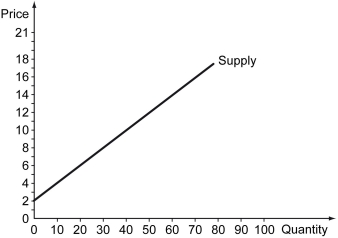
A) 1
B) 1.25
C) 0.50
D) 0.75
Correct Answer:

Verified
Correct Answer:
Verified
Related Questions
Q26: As the amount of inventory maintained by
Q27: Marginal cost is the _.<br>A) cost(s) a
Q28: Sellers in a perfectly competitive market _.<br>A)
Q29: In a perfectly competitive market,firms earn zero
Q30: A production function establishes the relationship between
Q32: The figure below shows the supply and
Q33: In a perfectly competitive market,sellers _.<br>A) coordinate
Q34: The following table shows the total output,
Q35: Using the notation in the text,AFC equals
Q36: Calculate the price elasticity of supply for