Multiple Choice
The figure below shows the supply and the demand for a good (left) and the cost curves of an individual firm in this market (right) . Assume that all firms in this market, including the potential entrants, have identical cost curves. Initially, the market is in equilibrium at point A.
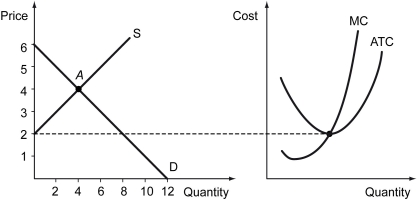
-Refer to the figure above.At the equilibrium A,each firm in the market earns ________ and there will be ________.
A) positive economic profit; entries of new firms
B) negative economic profit; exit of existing firms
C) zero economic profit; both entry and exit of firms
D) zero accounting profit; entries of new firms
Correct Answer:

Verified
Correct Answer:
Verified
Q27: Marginal cost is the _.<br>A) cost(s) a
Q28: Sellers in a perfectly competitive market _.<br>A)
Q29: In a perfectly competitive market,firms earn zero
Q30: A production function establishes the relationship between
Q31: The following graph shows the supply curve
Q33: In a perfectly competitive market,sellers _.<br>A) coordinate
Q34: The following table shows the total output,
Q35: Using the notation in the text,AFC equals
Q36: Calculate the price elasticity of supply for
Q37: If firms in a perfectly competitive market