Essay
Scenario: The table below lists the willingness to pay for ten potential buyers of a Walter Payton rookie card and the willingness to accept for ten potential sellers of the card. (Walter Payton was a running back for the NFL's Chicago Bears from 1985 to 1987 and was elected into the NFL's Hall of Fame in 1993.) The graph below the table can be used to display the demand and supply schedules.
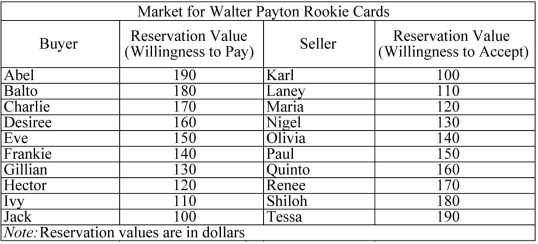
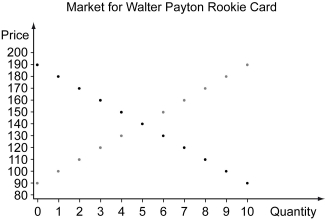
-Refer to the scenario above.In the graph above,plot the market demand schedule from the willingness to pay of buyers,and graph the market supply schedule from the willingness to accept of sellers.(Hint: Use the stairstep method similar to Exhibits 7.2 and 7.3 in the textbook; over and down for drawing market demand,and up and over for drawing market supply.)
Correct Answer:

Verified
The comple...View Answer
Unlock this answer now
Get Access to more Verified Answers free of charge
Correct Answer:
Verified
View Answer
Unlock this answer now
Get Access to more Verified Answers free of charge
Q2: Which of the following statements is true?<br>A)
Q3: Scenario: There are two firms producing ballpoint
Q4: Scenario: The figure on the left shows
Q5: The following graph represents the market for
Q6: The following figure shows the demand and
Q8: Scenario: The rare earth element neodymium is
Q9: After the imposition of the price controls,
Q10: Differentiate between the coordination problem and the
Q11: _ relates to the distribution of resources
Q12: The following figure illustrates the marginal cost