Multiple Choice
The following figure shows the demand and supply curves for bottled water.
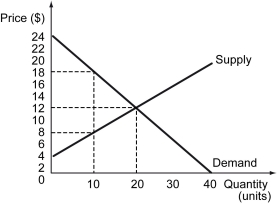
-Refer to the figure above.What is the equilibrium price of bottled water?
A) $4
B) $8
C) $12
D) $18
Correct Answer:

Verified
Correct Answer:
Verified
Related Questions
Q1: The invisible hand is mostly guided by
Q2: Which of the following statements is true?<br>A)
Q3: Scenario: There are two firms producing ballpoint
Q4: Scenario: The figure on the left shows
Q5: The following graph represents the market for
Q7: Scenario: The table below lists the willingness
Q8: Scenario: The rare earth element neodymium is
Q9: After the imposition of the price controls,
Q10: Differentiate between the coordination problem and the
Q11: _ relates to the distribution of resources