Multiple Choice
The following figure shows the marginal cost curve and the average total cost curve of a firm operating in a perfectly competitive market.
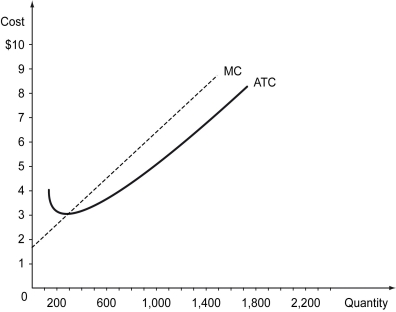
-Refer to the figure above.Suppose the price in this market is $5.What is the revenue of the firm,when it sells the profit-maximizing level of output?
A) $5,000
B) $1,600
C) $1,800
D) $3,500
Correct Answer:

Verified
Correct Answer:
Verified
Q28: The social surplus in a market is
Q29: The reservation value of a buyer reflects
Q30: Which of the following statements is true?<br>A)
Q31: Scenario: The table below lists the willingness
Q32: Scenario: A small firm manufactures maple baseball
Q34: A price control is _.<br>A) a market-determined
Q35: When existing firms leave a perfectly competitive
Q36: The following table displays the reservation values
Q37: The following table displays the reservation values
Q38: The following figure shows the marginal cost