Multiple Choice
The following figure shows the marginal cost curve and the average total cost curve of a firm operating in a perfectly competitive market. All of the other firms in this market have a cost structure similar to this firm's.
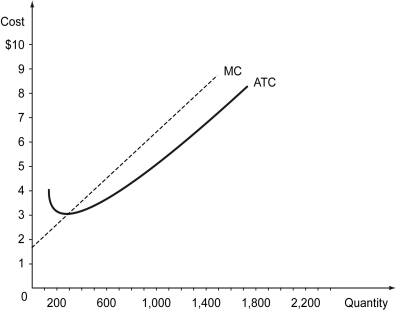
-Refer to the figure above.Suppose the price in this market is $5.We expect ________.
A) the firms to start exiting this market
B) the firms to start entering this market
C) no entry or exit in this market
D) exit from this market, followed by entry of firms into this market
Correct Answer:

Verified
Correct Answer:
Verified
Q33: The following figure shows the marginal cost
Q34: A price control is _.<br>A) a market-determined
Q35: When existing firms leave a perfectly competitive
Q36: The following table displays the reservation values
Q37: The following table displays the reservation values
Q39: Suppose a market has only one seller
Q40: The following figure illustrates the demand and
Q41: The following figure illustrates the demand and
Q42: The following figure illustrates the demand and
Q43: The following figure shows the marginal cost