Multiple Choice
The following figure shows the marginal cost curve and the average total cost curve of a firm operating in a perfectly competitive market.
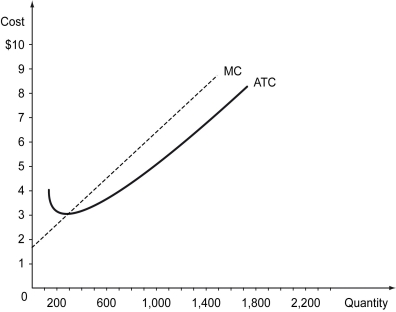
-Refer to the figure above.Suppose the price in this market is $5.What is the total cost of the firm,when it produces the profit-maximizing level of output?
A) $600
B) $1,200
C) $2,800
D) $2,400
Correct Answer:

Verified
Correct Answer:
Verified
Q38: The following figure shows the marginal cost
Q39: Suppose a market has only one seller
Q40: The following figure illustrates the demand and
Q41: The following figure illustrates the demand and
Q42: The following figure illustrates the demand and
Q44: Which of the following statements is true?<br>A)
Q45: Scenario: Suppose a competitive market has ten
Q46: When an outcome is Pareto efficient,_.<br>A) social
Q47: The following figure illustrates the demand and
Q48: The following figure shows the demand and