Multiple Choice
The following figure illustrates the demand and supply curves for a good.
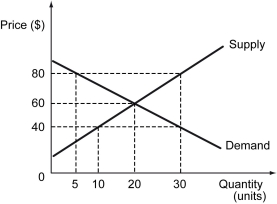
-Refer to the figure above.What is the equilibrium price and quantity of the good?
A) Equilibrium price is $40, equilibrium quantity is 20 units.
B) Equilibrium price is $60, equilibrium quantity is 10 units.
C) Equilibrium price is $60, equilibrium quantity is 20 units.
D) Equilibrium price os $80, equilibrium quantity is 30 units.
Correct Answer:

Verified
Correct Answer:
Verified
Q67: The following table displays the reservation values
Q68: A firm owns two production plants. The
Q69: The existence of positive profits in a
Q70: Efficiency in competitive markets is characterized by
Q71: The following figure shows the demand and
Q73: The following table displays the reservation values
Q74: The concept of the invisible hand suggests
Q75: Take a deck of playing cards and
Q76: The tables below show reservation values of
Q77: The tables below show reservation values of