menu-iconExamlexExamLexServices

Discover

Ask a Question
  1. All Topics
  2. Topic
    Business
  3. Study Set
    Microeconomics
  4. Exam
    Exam 7: Perfect Competition and the Invisible Hand
  5. Question
    The Following Figure Shows the Demand and Supply Curves for Bottled
Solved

The Following Figure Shows the Demand and Supply Curves for Bottled

Question 71

Question 71

Multiple Choice

The following figure shows the demand and supply curves for bottled water.
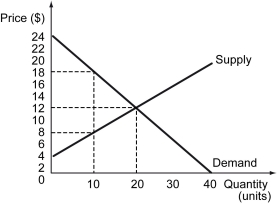
The following figure shows the demand and supply curves for bottled water.    -Refer to the figure above.What is the producer surplus in the market? A)  $20 B)  $40 C)  $60 D)  $80
-Refer to the figure above.What is the producer surplus in the market?


A) $20
B) $40
C) $60
D) $80

Correct Answer:

verifed

Verified

Unlock this answer now
Get Access to more Verified Answers free of charge

Related Questions

Q66: What is likely to happen to the

Q67: The following table displays the reservation values

Q68: A firm owns two production plants. The

Q69: The existence of positive profits in a

Q70: Efficiency in competitive markets is characterized by

Q72: The following figure illustrates the demand and

Q73: The following table displays the reservation values

Q74: The concept of the invisible hand suggests

Q75: Take a deck of playing cards and

Q76: The tables below show reservation values of

Examlex

ExamLex

About UsContact UsPerks CenterHomeschoolingTest Prep

Work With Us

Campus RepresentativeInfluencers

Links

FaqPricingChrome Extension

Download The App

Get App StoreGet Google Play

Policies

Privacy PolicyTerms of ServiceHonor CodeCommunity Guidelines

Scan To Download

qr-code

Copyright © (2025) ExamLex LLC.

Privacy PolicyTerms Of ServiceHonor CodeCommunity Guidelines