Multiple Choice
The following figure shows the production possibilities curve for a software engineer who has to divide her available time between producing computer programs and Web sites.
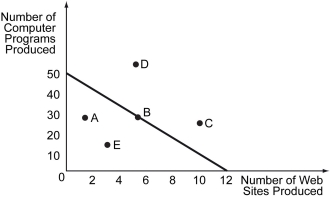
-Refer to the figure above.If the engineer spends her entire time on producing Web sites,how many Web sites can she produce?
A) 2
B) 5
C) 10
D) 12
Correct Answer:

Verified
Correct Answer:
Verified
Q140: Scenario: Now suppose the United States continues
Q141: The following figure shows the demand curve,
Q142: Scenario: Suppose a country produces only two
Q143: The following figure represents various production possibilities
Q144: The figure below shows the domestic supply
Q146: In the mid-nineteenth century,the American steel rail
Q147: Which of the following is not a
Q148: A(n)_ is any good that is produced
Q149: The following figure depicts the production possibilities
Q150: Scenario: The domestic supply and demand of