Multiple Choice
The following figure represents various production possibilities curves (PPCs) of economies that produce apples and oranges.
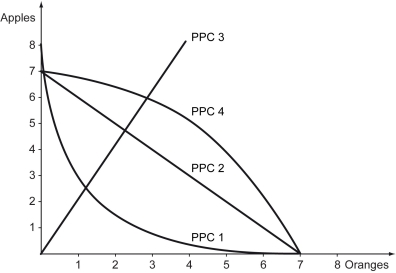
-Refer to the figure above.An economy produces apples and oranges.To expand the production of oranges,this economy needs to give up producing more and more apples.Which of the curves in the figure correctly represents the production possibilities frontier of this economy?
A) PPC 1
B) PPC 2
C) PPC 3
D) PPC 4
Correct Answer:

Verified
Correct Answer:
Verified
Q138: The shift toward more open,integrated economies that
Q139: Scenario: Hawaii and South Carolina are trading
Q140: Scenario: Now suppose the United States continues
Q141: The following figure shows the demand curve,
Q142: Scenario: Suppose a country produces only two
Q144: The figure below shows the domestic supply
Q145: The following figure shows the production possibilities
Q146: In the mid-nineteenth century,the American steel rail
Q147: Which of the following is not a
Q148: A(n)_ is any good that is produced