Multiple Choice
The following figure shows the production possibilities curve for Sheena, who has to split her time between producing Web sites and computer programs.
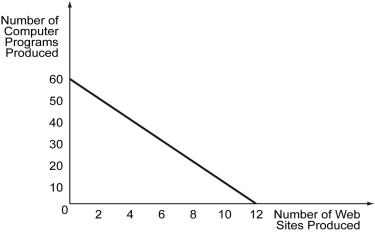
-Refer to the figure above.What is the opportunity cost of producing 1 Web site?
A) 0.2 computer programs
B) 5 computer programs
C) 12 computer programs
D) 60 computer programs
Correct Answer:

Verified
Correct Answer:
Verified
Q202: Increasing opportunity cost can arise if _.<br>A)
Q203: The following figure depicts the production possibilities
Q204: The figure below shows the domestic supply
Q205: The figure below shows the domestic supply
Q206: The following figure shows the demand curve,
Q208: The figure below shows production possibilities curves
Q209: The following figure shows the production possibilities
Q210: How are the following events likely to
Q211: Which of the following correctly identifies an
Q212: Scenario: Yasmin and Zeek are lawyers working