Multiple Choice
The figure below shows production possibilities curves for tomatoes and oranges in two prefectures in a country.
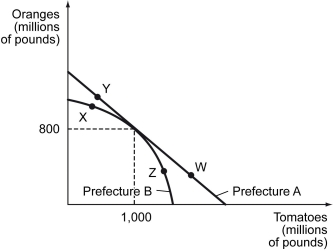
-Refer to the figure above.In Prefecture B,the opportunity cost of producing each additional pound of tomatoes ________.
A) increases as more tomatoes are produced
B) decreases as more tomatoes are produced
C) increases up to 1 billion pounds and then decreases after 1 billion pounds
D) decreases up to 1 billion pounds and then decreases after 1 billion pounds
Correct Answer:

Verified
Correct Answer:
Verified
Q203: The following figure depicts the production possibilities
Q204: The figure below shows the domestic supply
Q205: The figure below shows the domestic supply
Q206: The following figure shows the demand curve,
Q207: The following figure shows the production possibilities
Q209: The following figure shows the production possibilities
Q210: How are the following events likely to
Q211: Which of the following correctly identifies an
Q212: Scenario: Yasmin and Zeek are lawyers working
Q213: The figure below shows the domestic supply