Multiple Choice
The following figure shows the production possibilities curves (PPCs) of two individuals, Ryan and Tom.
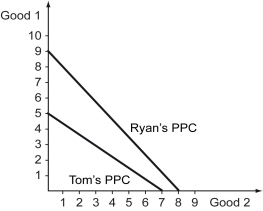
-Refer to the figure above.Which of the following statements is true?
A) Tom has an absolute disadvantage in the production of Good 1, whereas Ryan has an absolute disadvantage in the production of Good 2.
B) Ryan has an absolute disadvantage in the production of Good 1, whereas Tom has an absolute disadvantage in the production of Good 2.
C) Tom can produce fewer of both goods given the same amount of resources as Ryan.
D) Ryan can produce fewer of both goods given the same amount of resources as Tom.
Correct Answer:

Verified
Correct Answer:
Verified
Q229: The following figure shows the demand curve,
Q230: The production possibilities schedules and curves for
Q231: Two countries,A and B,produce Good X.Which of
Q232: Scenario: You learned in the textbook that
Q233: Which of the following statements is true?<br>A)
Q235: How are the domestic sellers and buyers
Q236: Scenario: Yasmin and Zeek are lawyers working
Q237: A production possibilities curve shows the _.<br>A)
Q238: Points outside a production possibilities curve are
Q239: The figure below shows the potential gains