Multiple Choice
The figure below shows the potential gains from specialization for farms in Idaho and Iowa.
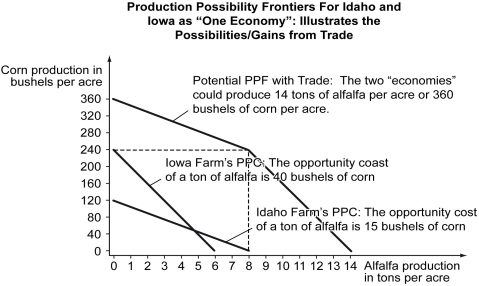
-Refer to the figure above.Under specialization,Idaho produces ________ and Iowa produces ________.
A) 8 tons of alfalfa; 240 bushels of corn
B) 6 tons of alfalfa; 120 bushels of corn
C) 4 tons of alfalfa; 3 tons of alfalfa
D) 60 bushels of corn; 120 bushels of corn
Correct Answer:

Verified
Correct Answer:
Verified
Q234: The following figure shows the production possibilities
Q235: How are the domestic sellers and buyers
Q236: Scenario: Yasmin and Zeek are lawyers working
Q237: A production possibilities curve shows the _.<br>A)
Q238: Points outside a production possibilities curve are
Q240: Scenario: The following figure shows the demand
Q241: Which of the following will cause an
Q242: A machine can manufacture 1 unit of
Q243: The following figure shows the demand curve,
Q244: The following figure shows the demand curve,