Multiple Choice
The following figure depicts four different scenarios in which the blue line represents California's production possibilities curve (PPC) and the red line represents Texas' PPC. These two states trade wine and cloth.
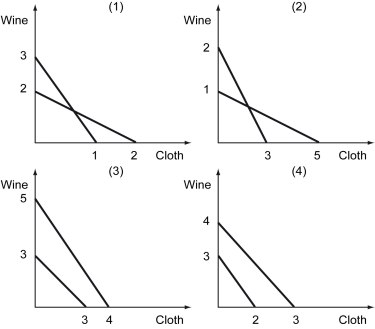
-Refer to the figure above.In what scenario would the terms of trade of wine for cloth be between 0.67 and 0.75?
A) (1)
B) (2)
C) (3)
D) (4)
Correct Answer:

Verified
Correct Answer:
Verified
Q59: The following table shows the quantity of
Q60: Scenario: Hawaii and South Carolina are trading
Q61: The following figure depicts a nonlinear production
Q62: The following figure shows the demand curve,
Q63: Which of the following statements is true?<br>A)
Q65: Which of the following statements is true?<br>A)
Q66: The following figure shows the demand curve,
Q67: The slope of a production possibilities curve
Q68: Which of the following correctly identifies an
Q69: What are the infant industry arguments against