Multiple Choice
The following figure shows the demand curve, D, and the supply curve, S, for calculators in Barylia in four different scenarios. Barylia is open to free trade.
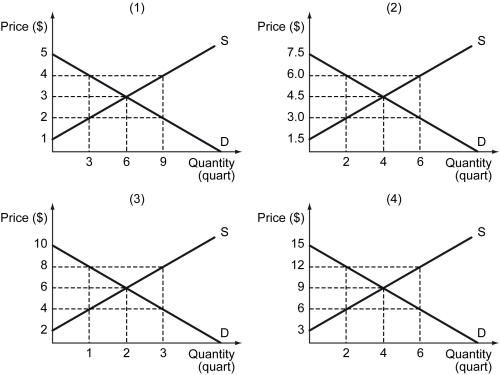
-Refer to the figure above.At a world price of $6,in which scenario(s) does Barylia see its domestic quantity demanded decrease?
A) (1)
B) (2)
C) (1) and (2)
D) (4)
Correct Answer:

Verified
Correct Answer:
Verified
Q57: An import is any good that is
Q58: Which of the following statements is not
Q59: The following table shows the quantity of
Q60: Scenario: Hawaii and South Carolina are trading
Q61: The following figure depicts a nonlinear production
Q63: Which of the following statements is true?<br>A)
Q64: The following figure depicts four different scenarios
Q65: Which of the following statements is true?<br>A)
Q66: The following figure shows the demand curve,
Q67: The slope of a production possibilities curve