Multiple Choice
The following figure shows the private cost and social cost of producing Good X.
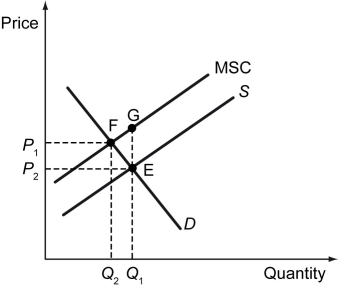
-Refer to the figure above.What does the region EFG represent?
A) Consumer surplus
B) Producer surplus
C) Deadweight loss
D) Economic profit
Correct Answer:

Verified
Correct Answer:
Verified
Related Questions
Q182: When the production of a good involves
Q183: Explanation: The following figure graphs the answer.<br>
Q184: The production of an industrial good in
Q185: The figure below shows the demand, supply,
Q186: The figure below shows the demand, supply,
Q188: Free access and unrestricted mining of iron
Q189: _ occurs when an individual has no
Q190: Four roommates have moved into an apartment.However,none
Q191: A corrective subsidy induces the _ toward
Q192: Scenario: The production of a good creates