Multiple Choice
The figure below shows the demand, supply, and marginal social benefit curves for Good Y.
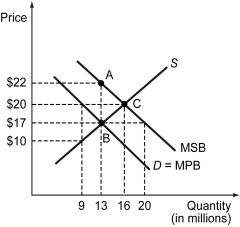
-Refer to the figure above.The MSB curve lies to the right of the demand curve because the production of Good Y involves ________.
A) positive externalities
B) negative externalities
C) increasing returns to scale
D) decreasing returns to scale
Correct Answer:

Verified
Correct Answer:
Verified
Q180: Scenario: The following excerpt is from Michael
Q181: The following figure shows the private cost
Q182: When the production of a good involves
Q183: Explanation: The following figure graphs the answer.<br>
Q184: The production of an industrial good in
Q186: The figure below shows the demand, supply,
Q187: The following figure shows the private cost
Q188: Free access and unrestricted mining of iron
Q189: _ occurs when an individual has no
Q190: Four roommates have moved into an apartment.However,none