Multiple Choice
The following figure shows the private cost and social cost of producing Good X.
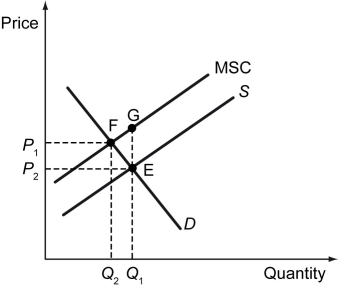
-Refer to the figure above.Which of the following statements is true in this case?
A) P₁ is the socially optimal price for Good X.
B) P₂ is the price of Good X in a free market.
C) Q₂ units is the efficient level of output of Good X.
D) Q₂ units is the quantity supplied of Good X in a free market.
Correct Answer:

Verified
Correct Answer:
Verified
Q176: The presence of a positive externality in
Q177: Which of the following correctly completes the
Q178: Scenario: In Brazil, more than 60 percent
Q179: A street light is a _.<br>A) private
Q180: Scenario: The following excerpt is from Michael
Q182: When the production of a good involves
Q183: Explanation: The following figure graphs the answer.<br>
Q184: The production of an industrial good in
Q185: The figure below shows the demand, supply,
Q186: The figure below shows the demand, supply,