Multiple Choice
The following figure shows the market supply and demand of a good whose production entails a $2 negative externality per unit.
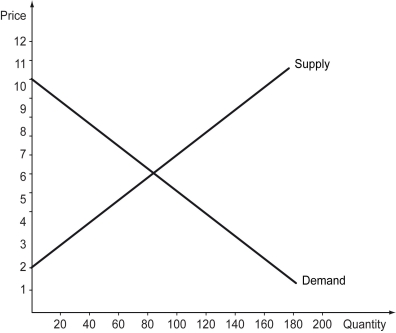
-Refer to the figure above.A total of ________ units of this good will be traded in this market,at the price of ________.
A) 80; $6
B) 20; $2
C) 60; $8
D) 40; $4
Correct Answer:

Verified
Correct Answer:
Verified
Q192: Scenario: The production of a good creates
Q193: Oil production by oil companies that use
Q194: Which of the following is not a
Q195: Scenario: Frank and Nancy live in a
Q196: Scenario: The following excerpt is from Michael
Q198: Scenario: Vacant houses, foreclosed or abandoned, are
Q199: If the production of a chemical in
Q200: What constitutes evidence for the efficacy of
Q201: Which of the following is true?<br>A) The
Q202: Scenario: Vacant houses, foreclosed or abandoned, are