Multiple Choice
The following figure shows the market supply and demand of a good whose production entails a $2 negative externality per unit.
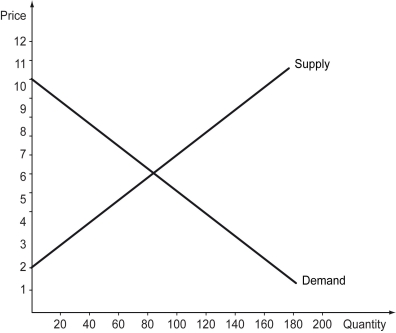
-Refer to the figure above.The socially optimal price for this good should be ________.
A) $6
B) $4
C) $8
D) $7
Correct Answer:

Verified
Correct Answer:
Verified
Related Questions
Q144: Which of the following results in a
Q145: The following figure shows the market supply
Q146: Suppose your roommate approaches you and asks
Q147: Scenario: Suppose there are only three houses
Q148: An externality occurs when _.<br>A) the quantity
Q150: Which of the following is most likely
Q151: A law stating that power plants are
Q152: Scenario: Vacant houses, foreclosed or abandoned, are
Q153: What is the difference between club goods
Q154: To derive the market demand for a