Multiple Choice
The following figure shows the market supply and demand of a good whose production entails a $2 negative externality per unit.
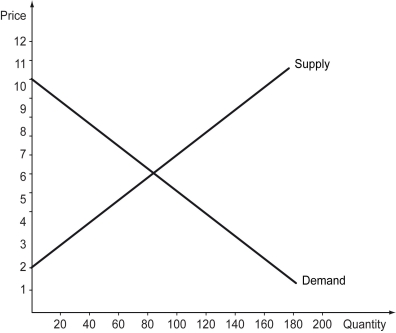
-Refer to the figure above.The socially optimal quantity of this good should be ________ units.
A) 60
B) 70
C) 80
D) 100
Correct Answer:

Verified
Correct Answer:
Verified
Q140: The poaching of African elephants for their
Q141: The Coase Theorem relies on internalizing externalities
Q142: The citizens of a country often refuse
Q143: The drainage of chemical fertilizers used on
Q144: Which of the following results in a
Q146: Suppose your roommate approaches you and asks
Q147: Scenario: Suppose there are only three houses
Q148: An externality occurs when _.<br>A) the quantity
Q149: The following figure shows the market supply
Q150: Which of the following is most likely