Multiple Choice
The figure below shows the demand, supply, and marginal social benefit curves for Good Y.
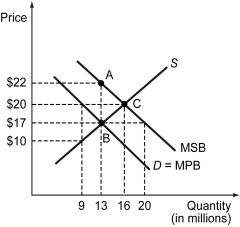
-Refer to the figure above.The triangular region ABC represents the ________.
A) deadweight loss due to the presence of a pecuniary externality
B) deadweight loss due to the presence of a negative externality
C) economic loss of not recognizing a positive externality
D) inefficiency created by not recognizing a negative externality
Correct Answer:

Verified
Correct Answer:
Verified
Q111: The consumption of a good entails a
Q112: If the consumption of a good involves
Q113: A video available on a Web site
Q114: When a Pigouvian tax is imposed,_.<br>A) the
Q115: Scenario: A chemical factory is located upstream
Q117: Public goods are _ in consumption.<br>A) excludable
Q118: Which of the following occurs when an
Q119: The tragedy of the commons occurs because
Q120: Which of the following is likely to
Q121: Scenario: Suppose there are only three houses