Multiple Choice
The consumption of a good entails a $2 positive external benefit per unit.The following graph shows the market supply and demand of this good.Which of the dashed lines represents the marginal social benefit curve?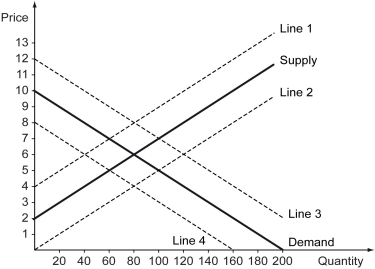
A) Line 1
B) Line 2
C) Line 3
D) Line 4
Correct Answer:

Verified
Correct Answer:
Verified
Q106: The government should provide an additional unit
Q107: The following figure shows the market supply
Q108: The figure below shows the demand, supply,
Q109: Which of the following happens when a
Q110: Cleanliness experts say that cleaning a house
Q112: If the consumption of a good involves
Q113: A video available on a Web site
Q114: When a Pigouvian tax is imposed,_.<br>A) the
Q115: Scenario: A chemical factory is located upstream
Q116: The figure below shows the demand, supply,