Multiple Choice
The figure below shows the demand, supply, and marginal social benefit curves for Good Y.
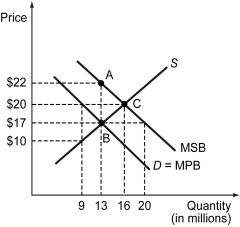
-Refer to the figure above.Social surplus can be increased by ________.
A) increasing output above 13 million units
B) reducing output below 13 million units
C) charging a price of $10
D) charging a price of $22
Correct Answer:

Verified
Correct Answer:
Verified
Q103: The total willingness to pay for public
Q104: Why do people refuse to pay for
Q105: Due to ongoing budget shortfalls,the city of
Q106: The government should provide an additional unit
Q107: The following figure shows the market supply
Q109: Which of the following happens when a
Q110: Cleanliness experts say that cleaning a house
Q111: The consumption of a good entails a
Q112: If the consumption of a good involves
Q113: A video available on a Web site