Multiple Choice
The following figure shows the marginal revenue (MR) and demand curves faced by a monopolist.
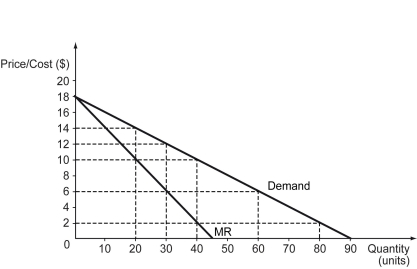
-Refer to the figure above.If the monopolist faces a constant marginal cost of $10,at what price should it sell its output?
A) $2
B) $10
C) $12
D) $14
Correct Answer:

Verified
Correct Answer:
Verified
Q259: The following figure shows the demand (D),
Q260: Differentiate between the quantity effect and price
Q261: Which of the following statements is true
Q262: If a monopoly engages in first-degree price
Q263: Which of the following correctly identifies a
Q265: The following figure shows the demand curve
Q266: Which of the following is true of
Q267: The following figure shows the market demand
Q268: When firms charge different prices to different
Q269: Suppose that a fire-fighting service is offered