Essay
The following figure shows the demand curve and the marginal revenue curve (MR)faced by a monopolist.The monopolist has a constant marginal cost of $3.
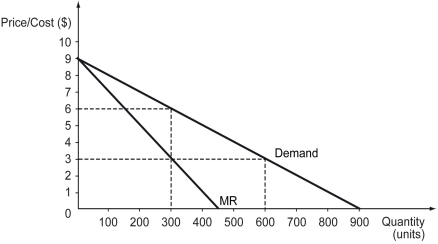
Calculate consumer surplus,monopoly's surplus,and deadweight loss.
Correct Answer:

Verified
Consumer surplus = 0.5 × (9 ‒ ...View Answer
Unlock this answer now
Get Access to more Verified Answers free of charge
Correct Answer:
Verified
View Answer
Unlock this answer now
Get Access to more Verified Answers free of charge
Q260: Differentiate between the quantity effect and price
Q261: Which of the following statements is true
Q262: If a monopoly engages in first-degree price
Q263: Which of the following correctly identifies a
Q264: The following figure shows the marginal revenue
Q266: Which of the following is true of
Q267: The following figure shows the market demand
Q268: When firms charge different prices to different
Q269: Suppose that a fire-fighting service is offered
Q270: Firms with market power _.<br>A) are price