Multiple Choice
The following figure represents the cost and revenue curves of a firm that is producing a service in a monopoly market.
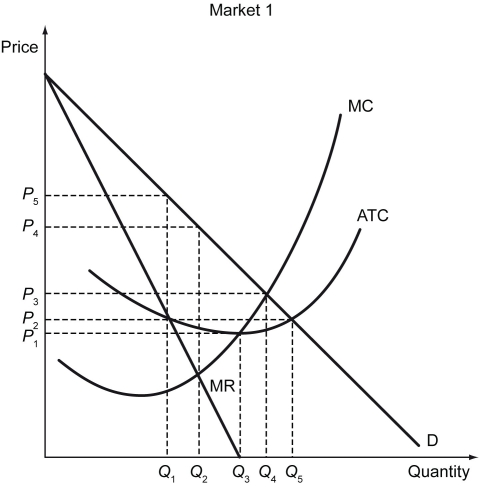
-Refer to the figure above.What is the optimal quantity that the monopolist should produce?
A) Q₁
B) Q₂
C) Q₄
D) Q₅
Correct Answer:

Verified
Correct Answer:
Verified
Related Questions
Q118: The total revenue curve of a monopolist
Q119: Price discrimination is never perfect because it
Q120: Scenario: Tobac Co. is a monopolist in
Q121: Scenario: The following excerpt is from "Throwing
Q122: Scenario: Mr. Olivander has a monopoly on
Q124: Marginal revenue is less than the price
Q125: Which of the following statements is true
Q126: A price-maker is a firm that _.<br>A)
Q127: Which of the following firms is most
Q128: The following figure shows the market demand