Multiple Choice
The following figure shows the market demand curve for penicillin, an antibiotic medicine. Initially, the market was supplied by perfectly competitive firms. Later, the government granted the exclusive right to produce and sell penicillin to one firm. The figure also shows the marginal revenue curve (MR) of the firm once it begins to operate as a monopoly. The marginal cost is constant at $3, irrespective of the market structure.
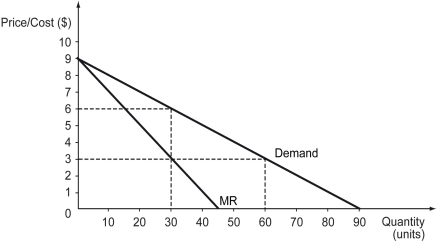
-Refer to the figure above.After the market changes from perfect competition to a monopoly,________.
A) social surplus decreases
B) the market price decreases
C) deadweight loss decreases
D) consumer surplus increases
Correct Answer:

Verified
Correct Answer:
Verified
Q123: The following figure represents the cost and
Q124: Marginal revenue is less than the price
Q125: Which of the following statements is true
Q126: A price-maker is a firm that _.<br>A)
Q127: Which of the following firms is most
Q129: A profit-maximizing monopolist produces the quantity at
Q130: The following figure shows the demand curve
Q131: The following figure shows the demand and
Q132: Scenario: When a monopolist charges $5 for
Q133: The following figure shows the marginal revenue