Multiple Choice
The figure below shows the cost and revenue curves of a firm in a monopoly market.The profit of this monopolist is represented by the area ________.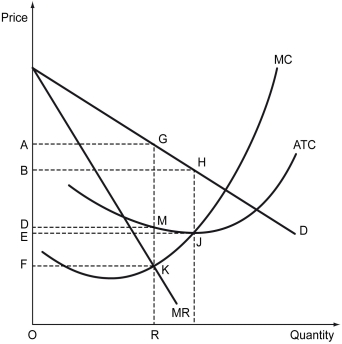
A) AGRO
B) AGMD
C) BHJE
D) AGKF
Correct Answer:

Verified
Correct Answer:
Verified
Related Questions
Q20: Differentiate between a patent and a copyright.
Q21: The following figure shows the demand curve
Q22: Scenario: Tobac Co. is a monopolist in
Q23: The following figure shows the demand (D),
Q24: The following figure shows the costs and
Q26: U.S.Code Title 18 § 1696 states<br>Whoever establishes
Q27: A profit-maximizing monopolist _.<br>A) can set any
Q28: Scenario: The following excerpt is from "Throwing
Q29: The following figure shows the demand curve,
Q30: The following figure shows price versus quantity