Multiple Choice
The following figure shows price versus quantity for a market.
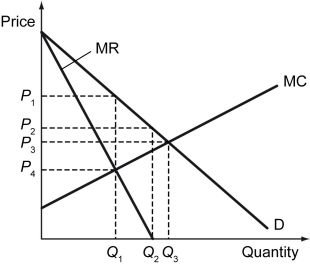
-Refer to the figure above.On what interval of quantity does total revenue decrease when quantity increases?
A) From 0 to Q₂
B) From Q₁ to Q₂
C) From Q₂ to infinity
D) Total revenue never decreases when quantity increases
Correct Answer:

Verified
Correct Answer:
Verified
Q25: The figure below shows the cost and
Q26: U.S.Code Title 18 § 1696 states<br>Whoever establishes
Q27: A profit-maximizing monopolist _.<br>A) can set any
Q28: Scenario: The following excerpt is from "Throwing
Q29: The following figure shows the demand curve,
Q31: A network externality occurs when _.<br>A) the
Q32: The following figure shows the demand curve,
Q33: Diet Coke _ considered a product in
Q34: Scenario: Tobac Co. is a monopolist in
Q35: The example of decoding the human genome