Multiple Choice
The figure below shows the cost and revenue curves of a firm in a monopoly market.
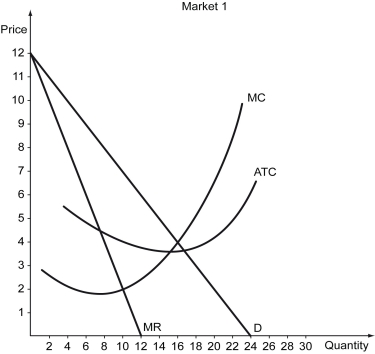
-Refer to the figure above.What is the optimal output for this firm?
A) 10
B) 12
C) 15
D) 16
Correct Answer:

Verified
Correct Answer:
Verified
Related Questions
Q131: The following figure shows the demand and
Q132: Scenario: When a monopolist charges $5 for
Q133: The following figure shows the marginal revenue
Q134: A monopolist faces a linear,downward-sloping demand curve.If
Q135: Scenario: Tobac Co. is a monopolist in
Q137: Suppose the government imposes fair-returns pricing on
Q138: Which of the following statements is true?<br>A)
Q139: Differentiate between a socially optimal price and
Q140: Which of the following is an example
Q141: Which of the following statements is true?<br>A)