Multiple Choice
The following figure shows the marginal revenue (MR) curve and the demand curve faced by a monopolist. The monopolist faces a constant marginal cost of $3.
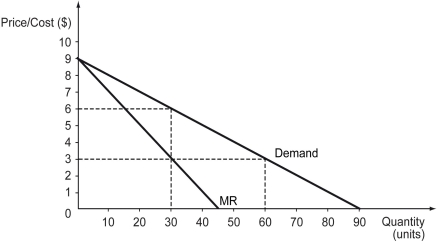
-Refer to the figure above.If the average cost faced by the monopolist when it produces and sells the optimal output is $4,the monopolist ________.
A) incurs a loss of $60
B) incurs a loss of $120
C) makes a profit of $60
D) makes a profit of $90
Correct Answer:

Verified
Correct Answer:
Verified
Q128: The following figure shows the market demand
Q129: A profit-maximizing monopolist produces the quantity at
Q130: The following figure shows the demand curve
Q131: The following figure shows the demand and
Q132: Scenario: When a monopolist charges $5 for
Q134: A monopolist faces a linear,downward-sloping demand curve.If
Q135: Scenario: Tobac Co. is a monopolist in
Q136: The figure below shows the cost and
Q137: Suppose the government imposes fair-returns pricing on
Q138: Which of the following statements is true?<br>A)