Multiple Choice
The following figure is a supply-demand diagram that characterizes the demand, marginal revenue, and cost curves for a profit-maximizing monopolist.
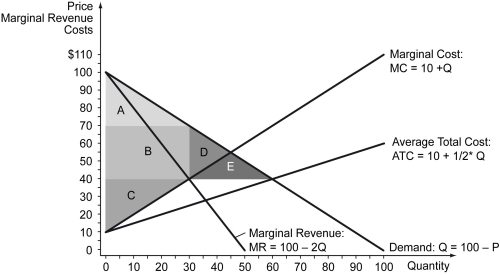
-Refer to the figure above.Under monopoly,producer surplus is ________.
A) Area B
B) Areas B + C
C) Areas A + B + C
D) Areas A + B + C + D
Correct Answer:

Verified
Correct Answer:
Verified
Related Questions
Q50: Which of the following is NOT an
Q51: What are the different types of price
Q53: Scenario: Tobac Co. is a monopolist in
Q54: The following figure shows the market demand
Q56: The investment by firms in the creation
Q57: If a firm can sell 15 units
Q58: The effect of the invisible hand is
Q59: Which of the following characterizes the relation
Q60: Which of the following does a social
Q136: The figure below shows the cost and