Multiple Choice
The following figure shows the demand curve, the marginal revenue (MR) curve, the marginal cost (MC) curve, and the average total cost (ATC) curve of a monopolist.
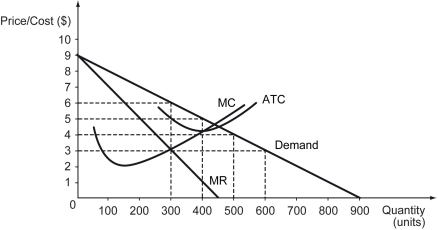
-Refer to the figure above.When the monopolist is free to set the price,________.
A) it makes a profit of $150
B) it incurs a loss of $150
C) it makes a profit of $300
D) it incurs a loss of $300
Correct Answer:

Verified
Correct Answer:
Verified
Q27: A profit-maximizing monopolist _.<br>A) can set any
Q28: Scenario: The following excerpt is from "Throwing
Q29: The following figure shows the demand curve,
Q30: The following figure shows price versus quantity
Q31: A network externality occurs when _.<br>A) the
Q33: Diet Coke _ considered a product in
Q34: Scenario: Tobac Co. is a monopolist in
Q35: The example of decoding the human genome
Q36: Economies of scale in production act as
Q37: Which of the following statements is true?<br>A)