Multiple Choice
The following figure shows the costs and revenue curves of a firm in a monopoly market.
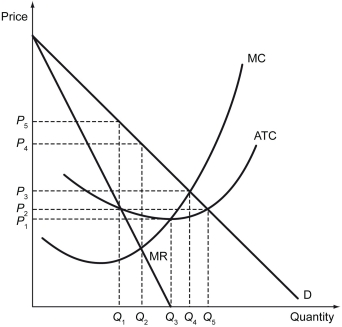
-Refer to the figure above.If the government decides to regulate this market at the socially optimal price level,the monopolist will ________.
A) make zero profit
B) make a positive profit
C) make a negative profit
D) exit this market
Correct Answer:

Verified
Correct Answer:
Verified
Q266: Which of the following is true of
Q267: The following figure shows the market demand
Q268: When firms charge different prices to different
Q269: Suppose that a fire-fighting service is offered
Q270: Firms with market power _.<br>A) are price
Q272: Which of the following firms is most
Q273: Scenario: Tobac Co. is a monopolist in
Q274: How does a monopoly decide the optimal
Q275: What are the problems associated with price
Q276: A monopolist faces an average total cost