Multiple Choice
The following figure shows the costs and revenue curves of a firm in a monopoly market.
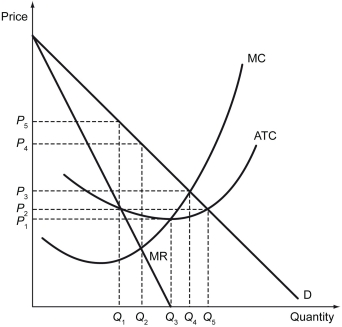
-Refer to the figure above.If the government decides to regulate this market at the socially optimal price level,it mandates the monopolist to sell its product at the price of ________.
A) $2
B) $5
C) $3
D) $10
Correct Answer:

Verified
Correct Answer:
Verified
Q1: The following figure shows the costs and
Q2: The price chosen by a monopolist _.<br>A)
Q4: Firms that provide services (e.g.,haircuts,landscaping,medical care,and dental
Q5: Scenario: When a monopolist charges $10 for
Q6: Scenario: Mr. Olivander has a monopoly on
Q7: Which of the following statements is true?<br>A)
Q8: The following figure shows the marginal revenue
Q9: Greenaqua Corp.was given the exclusive right to
Q10: How is the demand curve faced by
Q11: If the government imposes marginal cost pricing