menu-iconExamlexExamLexServices

Discover

Ask a Question
  1. All Topics
  2. Topic
    Business
  3. Study Set
    Microeconomics
  4. Exam
    Exam 12: Monopoly
  5. Question
    The Following Figure Shows the Costs and Revenue Curves of a Firm
Solved

The Following Figure Shows the Costs and Revenue Curves of a Firm

Question 1

Question 1

Multiple Choice

The following figure shows the costs and revenue curves of a firm in a monopoly market.
The following figure shows the costs and revenue curves of a firm in a monopoly market.    -Refer to the figure above.If this monopolist engages in the  first degree price discrimination,  he will charge ________ per unit of its output. A)  different prices B)  P₂ C)  P₃ D)  P₄
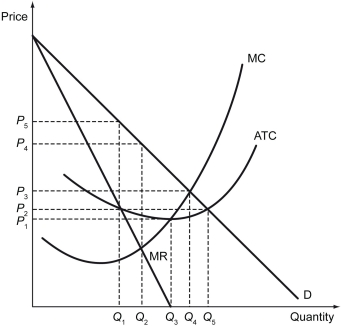
-Refer to the figure above.If this monopolist engages in the "first degree price discrimination," he will charge ________ per unit of its output.


A) different prices
B) P₂
C) P₃
D) P₄

Correct Answer:

verifed

Verified

Related Questions

Q2: The price chosen by a monopolist _.<br>A)

Q3: The following figure shows the costs and

Q4: Firms that provide services (e.g.,haircuts,landscaping,medical care,and dental

Q5: Scenario: When a monopolist charges $10 for

Q6: Scenario: Mr. Olivander has a monopoly on

Q7: Which of the following statements is true?<br>A)

Q8: The following figure shows the marginal revenue

Q9: Greenaqua Corp.was given the exclusive right to

Q10: How is the demand curve faced by

Q11: If the government imposes marginal cost pricing

Examlex

ExamLex

About UsContact UsPerks CenterHomeschoolingTest Prep

Work With Us

Campus RepresentativeInfluencers

Links

FaqPricingChrome Extension

Download The App

Get App StoreGet Google Play

Policies

Privacy PolicyTerms of ServiceHonor CodeCommunity Guidelines

Scan To Download

qr-code

Copyright © (2025) ExamLex LLC.

Privacy PolicyTerms Of ServiceHonor CodeCommunity Guidelines