Multiple Choice
The following figure shows the revenue and cost curves for a monopolistic competitor before and after several new firms enter the industry. Dₒld shows the demand curve before the entry of new firms, and Dnₑw shows the demand curve after the entry of new firms.
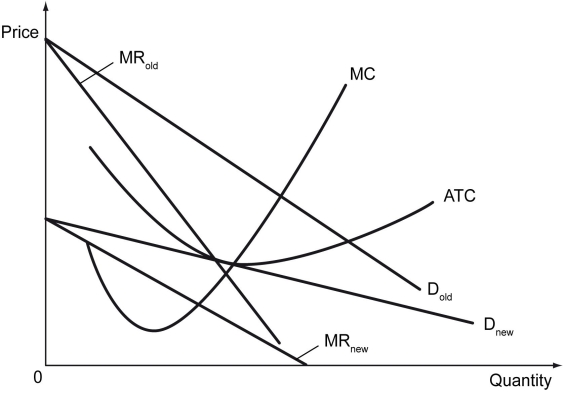
-Refer to the figure above.Which of the following is true?
A) The firm was incurring losses before the entry of new firms.
B) The firm was earning zero economic profits before the entry of new firms.
C) The firm is earning positive economic profits after the entry of new firms.
D) The firm is earning zero economic profits after the entry of new firms.
Correct Answer:

Verified
Correct Answer:
Verified
Q33: The entry of new firms into a
Q34: There are four firms in the cement
Q35: The U.S.book publishing industry is an example
Q36: A monopolistically competitive firm _ in the
Q37: Scenario: Two firms, Firm 1 and Firm
Q39: The equilibrium price charged by a monopolistic
Q40: A monopolistically competitive firm _.<br>A) can increase
Q41: All firms in a monopolistically competitive industry
Q42: Scenario: There are two firms in an
Q43: A monopolistically competitive firm shuts down in