Multiple Choice
The graph here represents a p-V diagram where the x axis is the volume in units of 10-3 m3 and the y axis is the pressure in units of 105 N/m2. The work done by the gas as it expands from (p1, V1) to (p2, V2) along the path indicated is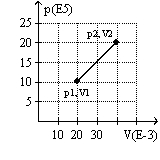
A) 30 kJ.
B) 10 kJ
C) -30 kJ.
D) 10 kJ.
Correct Answer:

Verified
Correct Answer:
Verified
Related Questions
Q12: The efficiency of a Carnot cycle is
Q13: The perpetual motion machine of the first
Q14: Two Carnot cycles have the same efficiency.
Q15: The graph here represents a p-V diagram
Q16: A container of 1.5 kg of water
Q18: During an adiabatic process the change in
Q19: When a vapor condenses, the entropy of
Q20: A Carnot air conditioner with CP =
Q21: The graph here represents a p-V diagram
Q22: The metric unit associated with entropy is<br>A)