Multiple Choice
The graph here represents a p-V diagram where the x axis is the volume in units of 10-3 m3 and the y axis is the pressure in units of 105 N/m2. The work done by the ideal gas as it follows the path sequence A to B to C to D back to A along the lines indicated is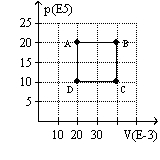
A) 80 kJ.
B) -80 kJ.
C) 20 kJ.
D) -20 kJ.
Correct Answer:

Verified
Correct Answer:
Verified
Related Questions
Q16: A container of 1.5 kg of water
Q17: The graph here represents a p-V diagram
Q18: During an adiabatic process the change in
Q19: When a vapor condenses, the entropy of
Q20: A Carnot air conditioner with CP =
Q22: The metric unit associated with entropy is<br>A)
Q23: 200 J of work is expended in
Q24: An ideal diatomic gas undergoes a two-step
Q25: During an expanding process 140 J of
Q26: For each 150 Btu a heat engine