Multiple Choice
The curve that correctly represents the relationship between the Fahrenheit and Celsius scales in a temperature (oC) versus temperature (oF) graph is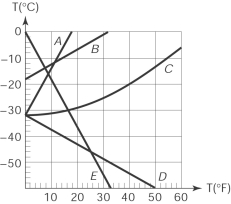
A) A
B) B
C) C
D) D
E) E
Correct Answer:

Verified
Correct Answer:
Verified
Related Questions
Q40: When asked to build a device that
Q41: The figure here shows the distribution
Q42: After we place ice in a glass
Q43: A 3.0 m <span class="ql-formula"
Q44: The number of molecules in a
Q46: The correct ranking of the magnitudes of
Q47: Two gases at the same temperature must
Q48: The figure here shows the distribution of
Q49: The mass of a deuterium (diatomic) molecule
Q50: A tire is filled with air at