Multiple Choice
The figure here shows the distribution of molecular speeds of a gas for two temperatures T1 and T2. The speed is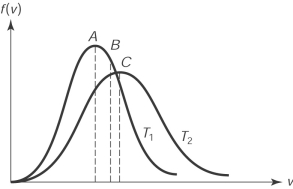
A) the rms speed of the molecules whose temperature is T1.
B) the rms speed of the molecules whose temperature is T2.
C) the average speed of the molecules whose temperature is T1.
D) the average speed of the molecules whose temperature is T2.
E) the most probable speed of the molecules whose temperature is T1.
Correct Answer:

Verified
Correct Answer:
Verified
Q36: The number of water molecules in 50
Q37: In the lungs, the respiratory membrane
Q38: Interstellar space, far from any stars,
Q39: Tylenol is a common painkiller containing acetaminophen
Q40: When asked to build a device that
Q42: After we place ice in a glass
Q43: A 3.0 m <span class="ql-formula"
Q44: The number of molecules in a
Q45: The curve that correctly represents the relationship
Q46: The correct ranking of the magnitudes of