Multiple Choice
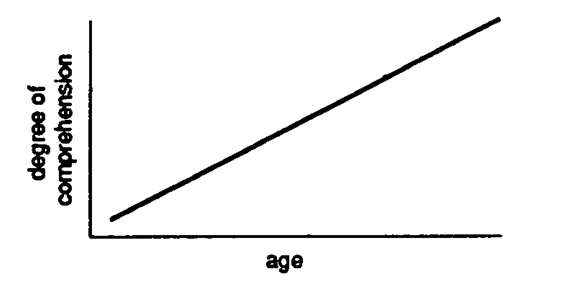
Describe each figure below as a frequency polygon, histogram, or line graph.
-
A) frequency polygon
B) histogram
C) line graph
Correct Answer:

Verified
Correct Answer:
Verified
Related Questions
Q32: A distribution with two separated peaks is
Q33: Line graphs are used more extensively in
Q34: Suppose a frequency distribution with a range
Q35: A line graph and a frequency polygon
Q36: Suppose you had frequency counts of sparrows,
Q38: The horizontal axis of a graph of
Q39: The serial position effect shows that when
Q40: Data Set 2-3 The graph in Data
Q41: College students listed all the states
Q42: Describe each figure below as a frequency