Multiple Choice
Describe each figure below as a frequency polygon, histogram, or line graph.
-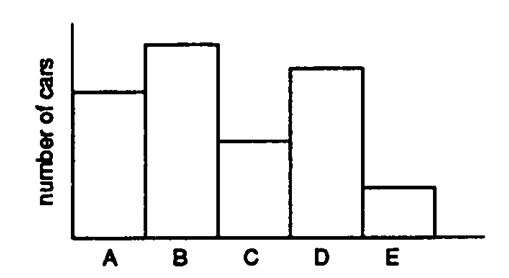
A) frequency polygon
B) histogram
C) line graph
Correct Answer:

Verified
Correct Answer:
Verified
Related Questions
Q37: Describe each figure below as a frequency
Q38: The horizontal axis of a graph of
Q39: The serial position effect shows that when
Q40: Data Set 2-3 The graph in Data
Q41: College students listed all the states
Q43: Horizontal axis, X-axis, and abscissa are all
Q44: Vertical axis, Y-axis, and abscissa are all
Q45: Which of the following intervals has a
Q46: Identify each graph below as correct or
Q47: Describe each graph below as correct or