Multiple Choice
Describe each graph below as correct or incorrect. Tell what is wrong with the incorrect one(s) .
-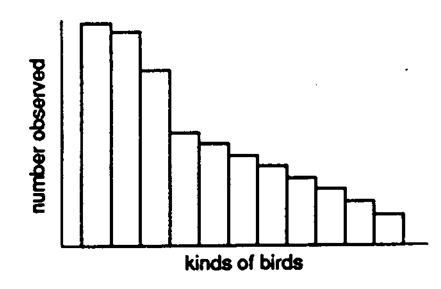
A) correct
B) incorrect
Correct Answer:

Verified
Correct Answer:
Verified
Related Questions
Q42: Describe each figure below as a frequency
Q43: Horizontal axis, X-axis, and abscissa are all
Q44: Vertical axis, Y-axis, and abscissa are all
Q45: Which of the following intervals has a
Q46: Identify each graph below as correct or
Q48: A negatively skewed curve has a thin
Q49: Skewness refers to<br>A) the shape of the
Q50: Line graphs are used more extensively in
Q51: The proper graph for the frequency distribution
Q52: A bar graph is used to present